Log in to your Inderes Free account to see all free content on this page.
Vincit
1.655
EUR
0 %
8,085 following
VINCIT
First North Finland
Software
Technology
Overview
Financials & Estimates
Ownership
Investor consensus
0%
-14.25%
-8.56%
-3.78%
-18.87%
-36.1%
-72.09%
-60.5%
-72.87%
Vincit provides services in design and software development. The services include, for example, software for e-commerce and web applications, cloud platforms, mobile applications and IoT solutions. The services are used by both small and medium-sized corporate customers. The main operations are in Europe and North America. Vincit was founded in 2007 and is headquartered in Finland.
Read moreMarket cap
28.06M EUR
Turnover
36.89K EUR
P/E (adj.) (25e)
EV/EBIT (adj.) (25e)
EV/S (25e)
Dividend yield-% (25e)
Revenue and EBIT-%
Revenue M
EBIT-% (adj.)
EPS and dividend
EPS (adj.)
Dividend %
Financial calendar
17.7.
2025
Interim report Q2'25
23.10.
2025
Interim report Q3'25
Risk
Business risk
Valuation risk
Low
High
All
Research
Press releases
ShowingAll content types
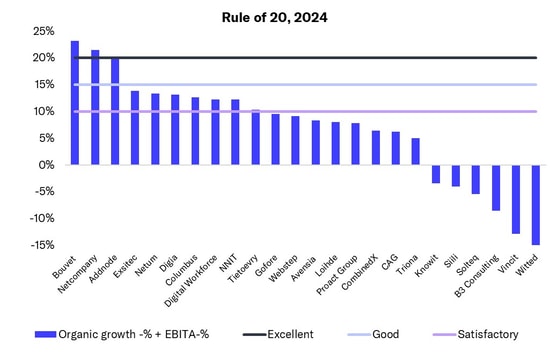
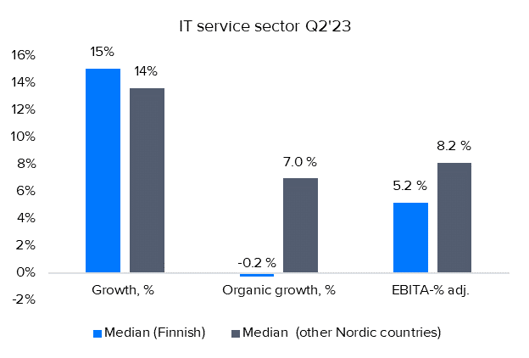
In the IT service sector, a few Nordic companies achieved excellent performance measured by the 'Rule of 20'
IT service sector: Q4 was tough, as was 2024
Join Inderes community
Don't miss out - create an account and get all the possible benefits
FREE account
Stock market's most popular morning newsletter
Analyst comments and recommendations
Stock comparison tool
PREMIUM account
All company reports and content
Premium tools (e.g. insider transactions & stock screener)
Model portfolio
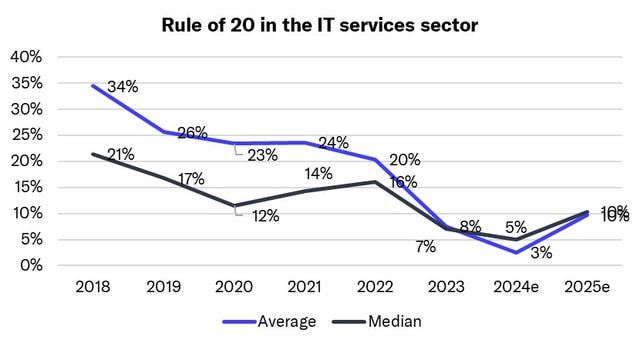
Introducing the Rule of 20: The best measure for IT services performance signals market softening
IT service sector: Bottom of cycle passed, grain will be separated from chaff in 2025
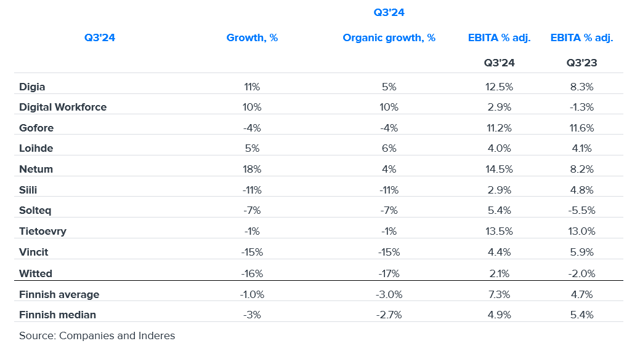
Q3 IT service sector summary: Revenue down but profitability up – sector shows clear divide
IT service sector: Market performance in Denmark and Norway better than in Finland and Sweden
IT services sector 2024 expectations fell slightly in Q2, but H2 looks a little better
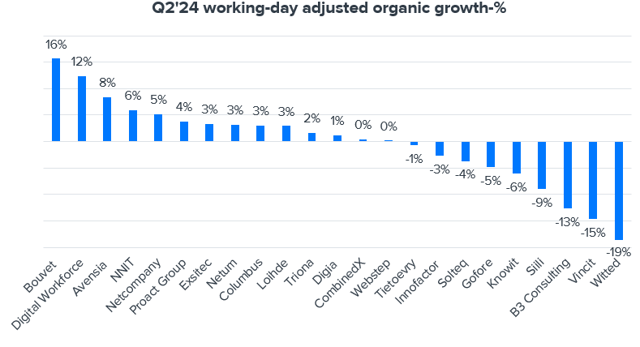
Q2 IT service sector summary: Slightly steeper revenue decline, improved profitability and signs of demand bottoming out
IT services sector's 2024 expectations fell slightly in Q1 - revenue expected to remain flat and profitability to rise slightly
IT service sector Q1 summary: Revenue and profitability down from a strong comparison period, but some defensive wins in profitability as well
IT service sector: Our expectations for 2024 generally at the lower end of companies' guidance

Q4 IT service sector summary: Growth and profitability in line with our expectations, 2023 can be seen as a defensive win
IT service sector valuation levels at the bottom of our 7-year monitoring history, justifiably?
We expect the IT services sector to grow moderately and profitability to increase slightly in 2024
IT services sector Q3 summary: Better than feared with several areas continuing to perform well