Log in to your Inderes Free account to see all free content on this page.
Sitowise Group
2.4
EUR
+0.42 %
2,392 following
SITOWS
NASDAQ Helsinki
Construction & Materials
Industrials
Overview
Financials & Estimates
Ownership
Investor consensus
+0.42%
-2.83%
-14.59%
-21.31%
-9.09%
-13.98%
-61.9%
-
-70.76%
Sitowise Group operates in the construction and infrastructure industry. The company specializes in the development of major construction projects. Examples of projects that the company carries out, on its own and in collaboration with other companies in the industry, include road and building construction, as well as pipe and underground constructions. The largest operations are in the Nordic market, where customers are found among corporate customers and public actors.
Read moreMarket cap
86.03M EUR
Turnover
989.35 EUR
P/E (adj.) (25e)
EV/EBIT (adj.) (25e)
P/B (25e)
EV/S (25e)
Dividend yield-% (25e)
Coverage


Revenue and EBIT-%
Revenue M
EBIT-% (adj.)
EPS and dividend
EPS (adj.)
Dividend %
Financial calendar
13.5.
2025
Interim report Q1'25
13.8.
2025
Interim report Q2'25
6.11.
2025
Interim report Q3'25
Risk
Business risk
Valuation risk
Low
High
All
Research
Webcasts
Press releases
ShowingAll content types
Decisions of the Annual General Meeting of Sitowise Group Plc
Change in Sitowise's Group Management Team
Join Inderes community
Don't miss out - create an account and get all the possible benefits
FREE account
Stock market's most popular morning newsletter
Analyst comments and recommendations
Stock comparison tool
PREMIUM account
All company reports and content
Premium tools (e.g. insider transactions & stock screener)
Model portfolio
Notice to the Annual General Meeting of Sitowise Group Plc
Sitowise Group Plc's annual reporting package 2024 has been published
Sitowise secures new financing agreement
Inside information: Sitowise has signed a secured financing agreement as an extension of its current financing arrangement
Sitowise: Announcement of a Change in Shareholding According to Chapter 9, Section 10 of the Finnish Securities Market Act
Sitowise: Announcement of a Change in Shareholding According to Chapter 9, Section 10 of the Finnish Securities Market Act

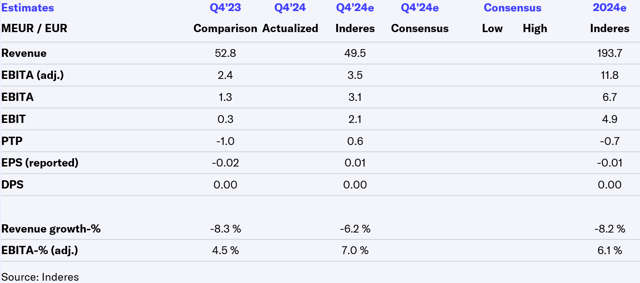
Sitowise Q4'24: Negative earnings trend
The Board of Directors of Sitowise has decided on new share plans
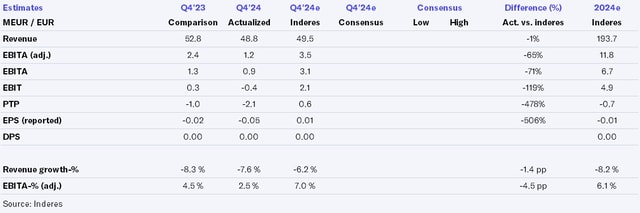
Sitowise Q4'24 flash comment: Poor result and lack of guidance point to challenges
Sitowise Financial Statement Release 2024: Finishing the year with strong cash flow, actions to improve profitability will continue
Sitowise Q4'24 preview: Dependent on market turnaround
Proposals of the Shareholders' Nomination Board of Sitowise for the Annual General Meeting 2025
Sitowise Extensive Report: Waiting for proof of turnaround
Sitowise: Digital solutions bring growth and profitability