Log in to your Inderes Free account to see all free content on this page.
Netum Group
1.16 EUR
+2.65 %
1,728 following
NETUM
First North Finland
IT Services
Technology
Overview
Financials & Estimates
Ownership
Investor consensus
+2.65 %
-4.92 %
-25.16 %
-37.63 %
-54.69 %
-55.04 %
-67.78 %
-
-73.93 %
Netum operates in the IT sector. The company specializes in the development of software solutions. The software is developed in-house and is mainly used for design and implementation of software, management and monitoring of information systems, cybersecurity solutions and IT management. The customers consist of corporate customers in several sectors. In addition to the main business, various value-added services are offered. The largest operations are in the Nordic region.
Read moreMarket cap
14.83M EUR
Turnover
6.51K EUR
P/E (adj.) (25e)
EV/EBIT (adj.) (25e)
EV/S (25e)
Dividend yield-% (25e)

Revenue and EBIT-%
Revenue M
EBIT-% (adj.)
EPS and dividend
EPS (adj.)
Dividend %
Risk
Business risk
Valuation risk
Low
High
All
Research
Press releases
3rd party
ShowingAll content types
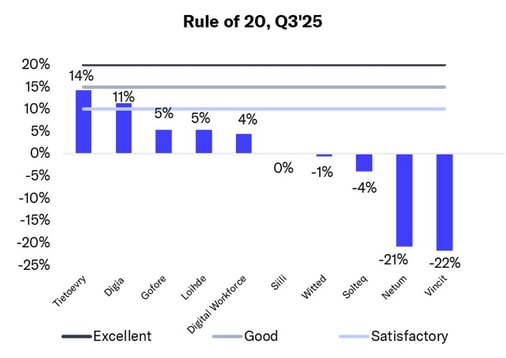
IT service sector Q3’25: Performance remained subdued
Changes in Netum Group Plc's Management Team: Outi Mattila appointed as a member of the Management Team, Mikko Koistinen, CEO of the subsidiary Buutti Oy, takes up the position of Strategic Account Director
Join Inderes community
Don't miss out - create an account and get all the possible benefits
FREE account
Stock market's most popular morning newsletter
Analyst comments and recommendations
Stock comparison tool
PREMIUM account
All company reports and content
Premium tools (e.g. insider transactions & stock screener)
Model portfolio