Log in to your Inderes Free account to see all free content on this page.
Solteq
0.64 EUR +1.59%6,092 investors are following this company
Solteq is an IT consulting company. The company specializes in ERP - Enterprise Resource Planning. Other services offered are related to financial management and inventory management. The customers consist of small and medium-sized corporate customers active in the retail and hotel industry. Solteq operates worldwide, with the largest presence in Europe, North America, and Asia.
P/E (adj.) (24e)
-16.85
EV/EBIT (adj.) (24e)
28.14
EV/S (24e)
0.68
Dividend yield-% (24e)
-
Target price
0.60 EUR
Recommendation
Sell
Updated
22.8.2024
NASDAQ Helsinki
SOLTEQ
Daily low / high price
0.632 / 0.668
EUR
Market cap
12.41M EUR
Turnover
6.21K EUR
Volume
9.5K
Business risk
Valuation risk
Current
Previous
Latest research
Extensive report
Inderes' extensive report is an investor's handbook on customer companies covered by our research.
The latest extensive report was released
Read the reportAnalyst

Joni Grönqvist
Analyst
Financial calendar
Interim report
24.10.2024
Major OwnersSource: Millistream Market Data AB
| Owner | Capital | Votes |
|---|---|---|
| Profiz Business Solution Oyj | 11.3 % | 11.3 % |
| Elo Mutual Pension Insurance Company | 10.3 % | 10.3 % |
Premium
This content is for our Premium customers only.
Insider Transactions
| Insider | Date | Total value |
|---|---|---|
| Aarne Aktan | 11.03.2024 | 7,198EUR |
| Aarne Aktan | 08.03.2024 | 6,285EUR |
Premium
This content is for our Premium customers only.
Forum updates
Income statement
| 2020 | 2021 | 2022 | 2023 | 2024e | 2025e | 2026e | 2027e | |
|---|---|---|---|---|---|---|---|---|
| Revenue | 60.5 | 69.1 | 68.4 | 57.7 | 54.3 | 55.9 | 58.3 | 60.9 |
| growth-% | 3.7 % | 14.2 % | -0.9 % | -15.7 % | -5.9 % | 3.0 % | 4.3 % | 4.4 % |
| EBITDA | 10.4 | 12.3 | 5.6 | 8.7 | 3.7 | 4.8 | 6.0 | 6.1 |
| EBIT (adj.) | 5.8 | 7.4 | 0.5 | -3.9 | 1.3 | 3.1 | 4.2 | 4.6 |
| EBIT | 5.4 | 7.1 | -4.4 | -3.5 | 1.3 | 3.1 | 4.2 | 4.6 |
| Profit before taxes | 2.7 | 5.2 | -6.6 | -4.7 | -1.1 | 0.5 | 0.7 | 2.6 |
| Net income | 2.0 | 4.1 | -5.4 | -5.4 | -1.1 | 0.4 | 0.5 | 2.1 |
| EPS (adj.) | 0.15 | 0.23 | -0.03 | -0.29 | -0.04 | 0.02 | 0.03 | 0.11 |
| growth-% | 175.5 % | 55.5 % | -112.1 % | 29.9 % | 294.9 % | |||
| Dividend | 0.15 | 0.10 | 0.00 | 0.00 | 0.00 | 0.00 | 0.00 | 0.00 |
| Dividend ratio | 146.3 % | 47.3 % |
Login required
This content is only available for logged in users
Profitability and return on capital
| 2020 | 2021 | 2022 | 2023 | 2024e | 2025e | 2026e | 2027e | |
|---|---|---|---|---|---|---|---|---|
| EBITDA-% | 17.2 % | 17.8 % | 8.1 % | 15.1 % | 6.9 % | 8.5 % | 10.3 % | 10.0 % |
| EBIT-% (adj.) | 9.6 % | 10.7 % | 0.7 % | -6.7 % | 2.4 % | 5.5 % | 7.3 % | 7.5 % |
| EBIT-% | 8.8 % | 10.3 % | -6.4 % | -6.1 % | 2.4 % | 5.5 % | 7.3 % | 7.5 % |
| ROE | 7.8 % | 15.0 % | -21.4 % | -27.1 % | -6.8 % | 2.5 % | 3.1 % | 11.4 % |
| ROI | 9.7 % | 12.3 % | -7.8 % | -7.1 % | 3.0 % | 7.2 % | 9.9 % | 10.6 % |
Login required
This content is only available for logged in users
Valuation
| 2020 | 2021 | 2022 | 2023 | 2024e | 2025e | 2026e | 2027e | |
|---|---|---|---|---|---|---|---|---|
| Share price (EUR) | 2.80 | 4.11 | 1.23 | 0.76 | 0.64 | 0.64 | 0.64 | 0.64 |
| Shares | 19.3 | 19.4 | 19.4 | 19.4 | 19.4 | 19.4 | 19.4 | 19.4 |
| Market cap | 54.1 | 79.7 | 23.9 | 14.7 | 12.4 | 12.4 | 12.4 | 12.4 |
| Enterprise value | 80.5 | 105.7 | 55.3 | 39.2 | 36.7 | 36.1 | 35.3 | 33.3 |
| EV/S | 1.3 | 1.5 | 0.8 | 0.7 | 0.7 | 0.6 | 0.6 | 0.5 |
| EV/EBITDA | 7.8 | 8.6 | 10.0 | 4.5 | 9.8 | 7.6 | 5.9 | 5.5 |
| EV/EBIT (adj.) | 13.9 | 14.3 | 118.6 | - | 28.1 | 11.7 | 8.3 | 7.3 |
| EV/EBIT | 15.1 | 14.8 | - | - | 28.1 | 11.7 | 8.3 | 7.3 |
| P/E (adj.) | 19.2 | 18.2 | - | - | - | 30.9 | 23.8 | 6.0 |
| P/E | 27.3 | 19.4 | - | - | - | 30.9 | 23.8 | 6.0 |
| P/B | 2.0 | 2.8 | 1.1 | 0.9 | 0.8 | 0.8 | 0.7 | 0.7 |
| P/S | 0.9 | 1.2 | 0.3 | 0.3 | 0.2 | 0.2 | 0.2 | 0.2 |
| Dividend yield | 5.4 % | 2.4 % | ||||||
| Equity ratio | 35.5 % | 36.9 % | 30.3 % | 30.1 % | 28.7 % | 29.2 % | 29.9 % | 33.1 % |
| Gearing ratio | 99.9 % | 92.6 % | 139.4 % | 142.3 % | 150.8 % | 143.7 % | 134.7 % | 109.4 % |
Login required
This content is only available for logged in users
Quarter data
| Q3/23 | Q4/23 | 2023 | Q1/24 | Q2/24 | Q3/24e | Q4/24e | 2024e | Q1/25e | |
|---|---|---|---|---|---|---|---|---|---|
| Revenue | 12.2 | 14.3 | 57.7 | 13.6 | 13.4 | 12.5 | 14.8 | 54.3 | |
| EBITDA | 0.5 | -0.8 | 8.7 | 0.4 | 0.6 | 1.1 | 1.7 | 3.7 | |
| EBIT | -0.7 | -9.1 | -3.5 | -0.2 | 0.0 | 0.5 | 1.1 | 1.3 | |
| Profit before taxes | -1.2 | -9.7 | -4.7 | -0.7 | -0.5 | -0.0 | 0.1 | -1.1 | |
| Net income | -1.0 | -8.3 | -5.4 | -0.7 | -0.5 | -0.0 | 0.1 | -1.1 |
Login required
This content is only available for logged in users
ShowingAll content types
The members of Shareholders' Nomination Committee of Solteq Plc have been appointed
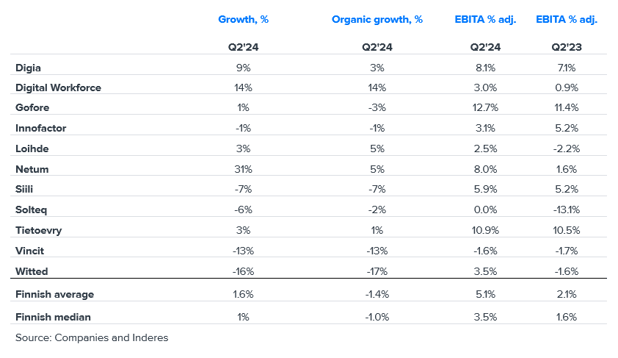
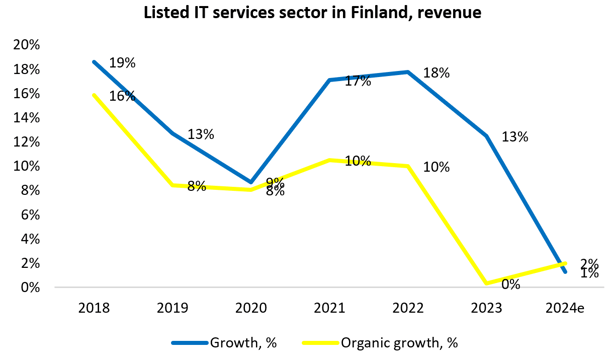
Q2 IT service sector summary: Slightly steeper revenue decline, improved profitability and signs of demand bottoming out
Join Inderes community
Don't miss out - create an account and get all the possible benefits
FREE account
Stock market's most popular morning newsletter
Analyst comments and recommendations
Stock comparison tool
PREMIUM account
All company reports and content
Premium tools (e.g. insider transactions & stock screener)
Model portfolio
Solteq Plc's Half-Year Report January 1 - June 30, 2024
Solteq commences a written procedure to amend the terms and conditions of its EUR 23 million notes due 1 October 2024
Inside information: Solteq provides preliminary information about its second quarter and considers commencing a written procedure to extend the final maturity date of its EUR 23 million notes
Solteq's efficiency and cost-savings program has been completed
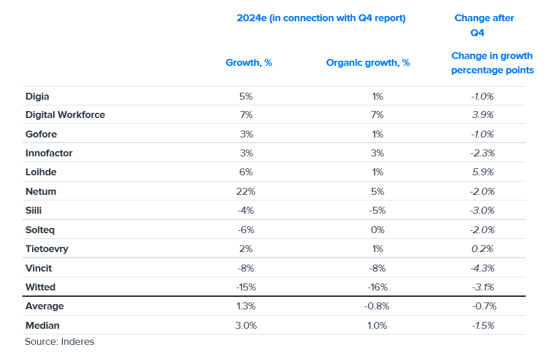
IT services sector's 2024 expectations fell slightly in Q1 - revenue expected to remain flat and profitability to rise slightly
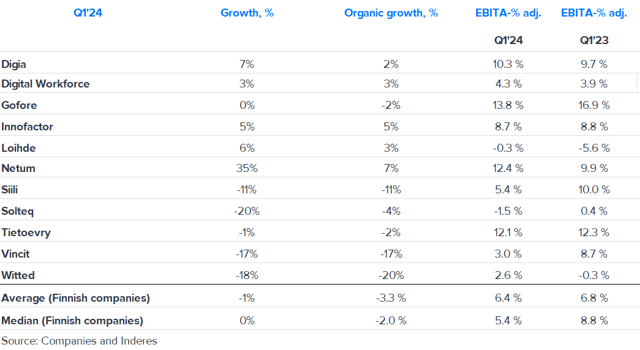
IT service sector Q1 summary: Revenue and profitability down from a strong comparison period, but some defensive wins in profitability as well
Inside information: Solteq to initiate an efficiency and cost-savings program to improve profitability
Solteq Plc's CEO Aarne Aktan to take on the leadership responsibilities of the Utilities segment
Solteq Plc's Interim Report January 1 - March 31, 2024
Solteq updates the definitions of comparable EBITDA and operating result, and publishes new figures concerning them for 2023
IT service sector: Our expectations for 2024 generally at the lower end of companies' guidance
Changes in Solteq Plc's Executive Team
Solteq Plc: Decisions of the Annual General Meeting 2024 and the Board of Directors' organizing meeting