Nibe Industrier
45,27
SEK
−0,68 %
NIBE B
NASDAQ Stockholm
Industrial Goods & Services
Industrials
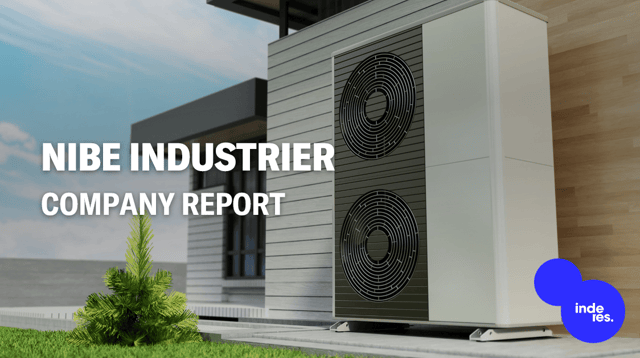
Nibe Industrier is an industrial company. The company offers services in heating solutions and energy management. The Group's operations are divided into a number of business areas and subsidiaries, each with special expertise. The company has customers on a global level with the largest concentration in the Nordic region, Europe and North America. The products are focused primarily on corporate customers and larger institutes, but also on private individuals. The company is headquartered in Markaryd, Sweden.
Lue lisääViimeisimmät analyysit
Laaja raportti
Analyytikko
Pörssikalenteri
Suurimmat omistajatLähde: Millistream Market Data AB
Omistaja | Osuus | Ääniä |
---|---|---|
Current and former board members and senior executives | 20,3 % | 45,9 % |
Schörling | 7,7 % | 18,8 % |
Inderes Premium
Tämä sisältö on vain Inderes Premium -käyttäjille.
Tuloslaskelma
2020 | 2021 | 2022 | 2023 | 2024e | 2025e | 2026e | 2027e | |
---|---|---|---|---|---|---|---|---|
Liikevaihto | 27 146,0 | 30 832,0 | 40 071,0 | 46 649,0 | 40 580,6 | 43 917,8 | 48 368,7 | 52 619,5 |
kasvu-% | 7,1 % | 13,6 % | 30,0 % | 16,4 % | −13,0 % | 8,2 % | 10,1 % | 8,8 % |
Käyttökate | 5 117,0 | 5 765,0 | 7 460,0 | 8 797,0 | 4 085,7 | 7 281,2 | 8 139,9 | 8 657,3 |
EBIT (oik.) | 3 557,0 | 4 451,0 | 5 764,0 | 7 069,0 | 3 150,7 | 5 211,2 | 5 949,2 | 6 480,0 |
EBIT | 3 880,0 | 4 468,0 | 5 863,0 | 6 973,0 | 2 055,7 | 5 211,2 | 5 949,2 | 6 480,0 |
Tulos ennen veroja | 3 658,0 | 4 318,0 | 5 675,0 | 6 331,0 | 945,1 | 4 542,0 | 5 370,5 | 5 951,6 |
Nettotulos | 2 866,0 | 3 320,0 | 4 351,0 | 4 785,0 | 411,1 | 3 516,2 | 4 177,0 | 4 632,8 |
EPS (oik.) | 1,26 | 1,64 | 2,11 | 2,42 | 0,65 | 1,74 | 2,07 | 2,30 |
kasvu-% | 14,5 % | 29,9 % | 28,7 % | 14,8 % | −73,2 % | 169,2 % | 18,8 % | 10,9 % |
Osinko | 0,39 | 0,50 | 0,65 | 0,65 | 0,35 | 0,55 | 0,80 | 0,69 |
Osingonjakosuhde | 27,3 % | 30,4 % | 30,1 % | 27,4 % | 171,7 % | 31,5 % | 38,6 % | 30,0 % |
Sisäänkirjautuminen vaadittu
Tämä sisältö on näkyvissä vain sisäänkirjautuneille käyttäjille
Kannattavuus ja pääoman tuotto
2020 | 2021 | 2022 | 2023 | 2024e | 2025e | 2026e | 2027e | |
---|---|---|---|---|---|---|---|---|
Käyttökate-% | 18,8 % | 18,7 % | 18,6 % | 18,9 % | 10,1 % | 16,6 % | 16,8 % | 16,5 % |
EBIT-% (oik.) | 13,1 % | 14,4 % | 14,4 % | 15,2 % | 7,8 % | 11,9 % | 12,3 % | 12,3 % |
EBIT-% | 14,3 % | 14,5 % | 14,6 % | 14,9 % | 5,1 % | 11,9 % | 12,3 % | 12,3 % |
Oman pääoman tuotto-% | 16,3 % | 17,0 % | 17,6 % | 17,3 % | 1,5 % | 12,6 % | 13,5 % | 13,7 % |
Sijoitetun pääoman tuotto-% | 14,1 % | 15,1 % | 16,7 % | 15,8 % | 4,3 % | 10,7 % | 11,8 % | 12,6 % |
Sisäänkirjautuminen vaadittu
Tämä sisältö on näkyvissä vain sisäänkirjautuneille käyttäjille
Arvostus
2020 | 2021 | 2022 | 2023 | 2024e | 2025e | 2026e | 2027e | |
---|---|---|---|---|---|---|---|---|
Osakekurssi (SEK) | 269,70 | 136,75 | 97,10 | 70,80 | 45,27 | 45,27 | 45,27 | 45,27 |
Osakemäärä | 504,0 | 2 016,1 | 2 016,1 | 2 016,1 | 2 016,1 | 2 016,1 | 2 016,1 | 2 016,1 |
Markkina-arvo | 135 933,4 | 275 697,6 | 195 760,4 | 142 737,8 | 91 267,5 | 91 267,5 | 91 267,5 | 91 267,5 |
Yritysarvo | 141 141,4 | 280 733,6 | 202 086,4 | 159 975,8 | 109 036,1 | 104 803,8 | 102 224,8 | 99 660,8 |
EV/S | 5,2 | 9,1 | 5,0 | 3,4 | 2,7 | 2,4 | 2,1 | 1,9 |
EV/EBITDA | 27,6 | 48,7 | 27,1 | 18,2 | 26,7 | 14,4 | 12,6 | 11,5 |
EV/EBIT (oik.) | 39,7 | 63,1 | 35,1 | 22,6 | 34,6 | 20,1 | 17,2 | 15,4 |
EV/EBIT | 36,4 | 62,8 | 34,5 | 22,9 | 53,0 | 20,1 | 17,2 | 15,4 |
P/E (oik.) | 213,8 | 83,5 | 46,0 | 29,2 | 69,9 | 26,0 | 21,8 | 19,7 |
P/E | 189,7 | 83,0 | 45,0 | 29,8 | 222,0 | 26,0 | 21,8 | 19,7 |
P/B | 7,7 | 12,9 | 7,0 | 5,2 | 3,4 | 3,1 | 2,8 | 2,6 |
P/S | 5,0 | 8,9 | 4,9 | 3,1 | 2,2 | 2,1 | 1,9 | 1,7 |
Osinkotuotto | 0,1 % | 0,4 % | 0,7 % | 0,9 % | 0,8 % | 1,2 % | 1,8 % | 1,5 % |
Omavaraisuusaste | 46,3 % | 49,9 % | 51,8 % | 40,3 % | 41,3 % | 44,2 % | 47,4 % | 50,4 % |
Nettovelkaisuusaste | 29,4 % | 23,3 % | 22,6 % | 62,9 % | 68,4 % | 47,4 % | 35,0 % | 24,7 % |
Sisäänkirjautuminen vaadittu
Tämä sisältö on näkyvissä vain sisäänkirjautuneille käyttäjille
Neljännesluvut
Q4/23 | 2023 | Q1/24 | Q2/24 | Q3/24 | Q4/24e | 2024e | Q1/25e | Q2/25e | |
---|---|---|---|---|---|---|---|---|---|
Liikevaihto | 11 656,0 | 46 649,0 | 9 494,0 | 10 035,0 | 9 967,0 | 11 084,6 | 40 580,6 | 10 331,5 | 10 855,9 |
Käyttökate | 2 092,0 | 8 797,0 | −76,0 | 1 210,0 | 1 383,0 | 1 568,7 | 4 085,7 | 1 554,8 | 1 758,0 |
EBIT | 1 592,0 | 6 973,0 | −579,0 | 669,0 | 912,0 | 1 053,7 | 2 055,7 | 1 069,8 | 1 248,0 |
Tulos ennen veroja | 1 378,0 | 6 331,0 | −911,0 | 396,0 | 626,0 | 834,1 | 945,1 | 869,8 | 1 068,0 |
Nettotulos | 980,0 | 4 785,0 | −857,0 | 219,0 | 433,0 | 616,1 | 411,1 | 686,2 | 825,6 |
Sisäänkirjautuminen vaadittu
Tämä sisältö on näkyvissä vain sisäänkirjautuneille käyttäjille
NIBE Industrier’s (publ) CEO and MD, Gerteric Lindquist, comments on the third quarter, 2024
NIBE Industrier AB (publ), Interim Report 3, 2024
Liity Inderesin yhteisöön
Älä jää mistään paitsi – luo käyttäjätunnus ja ota kaikki hyödyt irti Inderesin palvelusta.