Log in to your Inderes Free account to see all free content on this page.
Tokmanni Group
13.646
EUR
+1.14 %
13,585 following
TOKMAN
NASDAQ Helsinki
Retailers
Consumer Goods & Services
Overview
Financials & Estimates
Ownership
Investor consensus
+1.14%
+6.44%
+4.89%
+12.68%
+28.37%
-5.82%
-10.28%
+36.46%
+103.67%
Tokmanni Group is a variety discount retailer in the Nordics. The group has stores in Finland, Sweden and Denmark under the brand names Tokmanni, Dollarstore, Big Dollar, Click Shoes and Miny. In addition, Tokmanni has online stores. Tokmanni's headquarter and logistics centres are located in Mäntsälä, Finland. Dollarstore is headquartered in Kista, Stockholm with a central warehouse in Örebro. The group own a procurement company located in Shanghai together with a Norwegian discount store chain Europris.
Read moreMarket cap
803.32M EUR
Turnover
2.54M EUR
P/E (adj.) (25e)
EV/EBIT (adj.) (25e)
P/B (25e)
EV/S (25e)
Dividend yield-% (25e)

Latest research
Latest analysis report
Released: 10.03.2025
Revenue and EBIT-%
Revenue B
EBIT-% (adj.)
EPS and dividend
EPS (adj.)
Dividend %
Financial calendar
7.5.
2025
General meeting '25
8.5.
2025
Half year dividend
16.5.
2025
Business review Q1'25
Risk
Business risk
Valuation risk
Low
High
All
Research
Webcasts
Press releases
ShowingAll content types
Tokmanni Group Oyj: Tokmanni Group's Report by the Board of Directors and Financial Statements, Corporate Governance Statement and Remuneration Report for 2024 published
Tokmanni Group Oyj: Update to the Stock Exchange Release on 22 January 2025: Proposal of the Shareholders' Nomination Board for the Chairman of Tokmanni Group's Board of Directors
Join Inderes community
Don't miss out - create an account and get all the possible benefits
FREE account
Stock market's most popular morning newsletter
Analyst comments and recommendations
Stock comparison tool
PREMIUM account
All company reports and content
Premium tools (e.g. insider transactions & stock screener)
Model portfolio
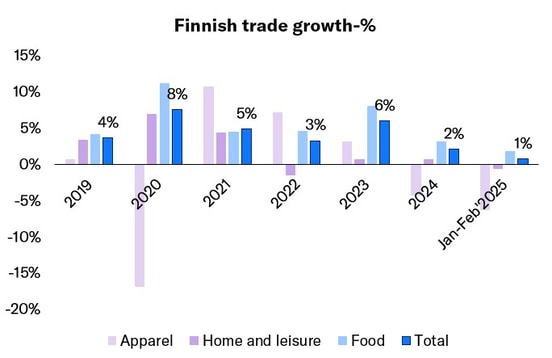
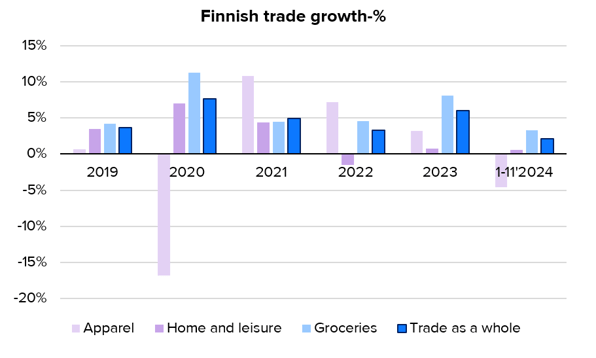
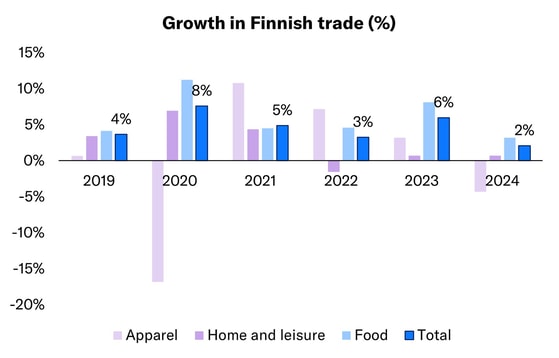
Finnish trade down in February
Tokmanni Group Oyj: Tokmanni Group Corporation: Managers' Transactions - Tapio Arimo
Tokmanni Group Oyj: Tokmanni Group Corporation: Managers' Transactions - Mika Rautiainen
Tokmanni Group Oyj: Change in the holding of Tokmanni Group Corporation's own shares
Tokmanni Q4’24: The story continues in the right direction
Tokmanni’s competitor Rusta grew strongly in its domestic market in Sweden

Tokmanni Q4'24: Revolving doors are spinning fast
Tokmanni Group Oyj: Tokmanni Group's Board of Directors confirmed the criteria for the new Performance Share Plan PSP 2025-2027 and realisation of the Restricted Share Plan RSP 2024-2026
Tokmanni Group Oyj: Tokmanni Group Corporation's Financial Statement Bulletin 2024: Revenue grew by 5.5% and comparable EBIT by 2.7% in the fourth quarter
Tokmanni Q4'24 preview: Strong result and guidance expected
Growth trend in Finnish trade in January followed last year's pattern
Lukewarm December seals sluggish trade year
Tokmanni Group Oyj: Proposal of the Shareholders' Nomination Board for the composition and remuneration of Tokmanni Group's Board of Directors

Tokmanni's analyst and press event at 2:00 pm EET
Tokmanni Group Oyj: Inside information: Tokmanni Oy has signed a licence agreement with SPAR International