Log in to your Inderes Free account to see all free content on this page.
Netum Group
2,12
EUR
−3,64 %
1 711 följer bolaget
NETUM
First North Finland
IT-Service
Teknologi
Overview
Financials & Estimates
Ownership
Investor consensus
−3,64%
−13,82%
−17,19%
−17,19%
−25,87%
−20,3%
−50,35%
-
−52,36%
Netum är verksamt inom IT-sektorn. Bolaget är specialiserat inom utveckling av mjukvarulösningar. Programvaran är egenutvecklad och används huvudsakligen för design och implementering av programvara, hantering och övervakning av informationssystem, cybersäkerhetslösningar samt för IT-management. Kunderna består av företagskunder verksamma i ett flertal sektorer. Utöver huvudverksamheten erbjuds diverse mervärdestjänster. Störst verksamhet återfinns inom Norden.
Läs meraBörsvärde
27,11 mn EUR
Omsatt (värde)
15,6 tn EUR
P/E (just.) (25e)
EV/EBIT (adj.) (25e)
EV/S (25e)
Direktavkastnings- % (25e)

Omsättning & EBIT-%
Omsättning mn
EBIT-%
Vinst per aktie & Utdelning
EPS (adj.)
Direktavkastning
Finansiell kalender
29.4.
2025
Business review Q1'25
19.8.
2025
Delårsrapport Q2'25
4.11.
2025
Business review Q3'25
Risk
Business risk
Valuation risk
Låg
Hög
Alla
Analys
Pressmeddelanden
Tredje part
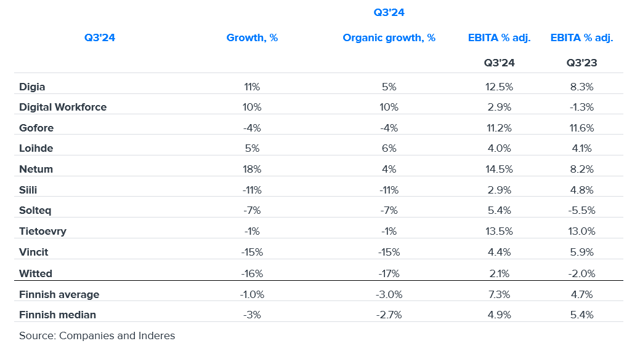
Outlook for the IT service sector 2025: Growth will kick off again at the end of the year
Resolutions of Netum Group Plc's Annual General Meeting and the constitutive meeting of the Board of Directors
Välkommen med i Inderes community!
Skapa ett gratis användarkonto och försäkra dig om att inte missa några börsnyheter av intresse för precis dig!
FREE account
Stock market's most popular morning newsletter
Tillgång till analytikerkommentarer och rekommendationer
Vårt eget aktiescreeningsverktyg
PREMIUM account
Alla aktieanalyser och övrigt innehåll
Premiumverktyg (insidertransaktioner och aktiescreeningsverktyg)
Inderes modellportfölj
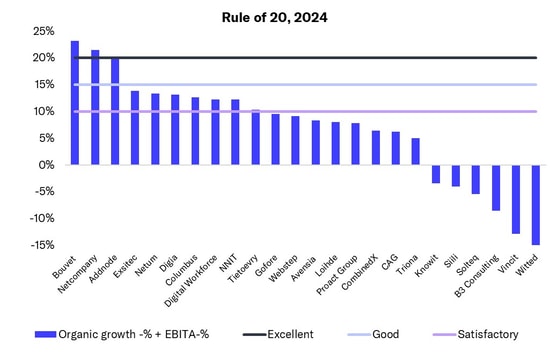
In the IT service sector, a few Nordic companies achieved excellent performance measured by the 'Rule of 20'
IT service sector: Q4 was tough, as was 2024
Netum Group Plc: The CEO of the subsidiary Studyo Oy stepping down
Netum Group Plc: Managers’ transactions – Köngäs
Notice to Netum Group Plc's Annual General Meeting 2025
Netum Group Plc’s Annual report 2024 published
Netum Group Plc’s financial statements release 2024: Significant growth and profitability improvement in 2024 – Q4 at the same level as comparison period
Netum will publish its financial statements release 2024 on Tuesday 25 February 2025
Transfer of Netum Group Plc's own shares for the payment of reward shares of the personnel offering – Change in the number of treasury shares held by the company
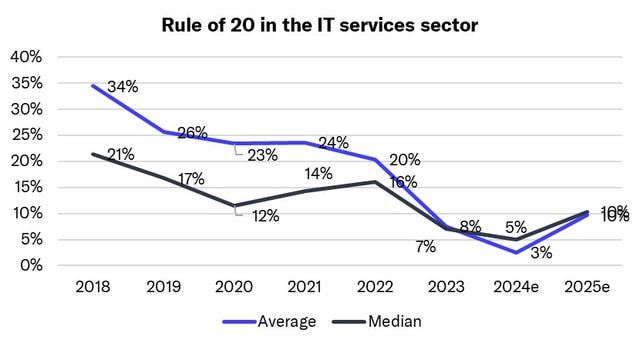
Introducing the Rule of 20: The best measure for IT services performance signals market softening
Change in Netum Group Plc's Board of Directors and Management Team – new CEO Repe Harmanen to start in his position on 10 January 2025
Netum Group Plc: Managers’ transactions – Köngäs
Netum Group Plc: Inside information, profit warning: Netum lowers its revenue guidance for 2024 and specifies its guidance on comparable EBITA
IT service sector: Bottom of cycle passed, grain will be separated from chaff in 2025