Log in to your Inderes Free account to see all free content on this page.
Solar Foods
5.4
EUR
+4.05 %
Less than 1K followers
SFOODS
First North Finland
Food Producers
Consumer Goods & Services
Overview
Financials & Estimates
Ownership
Investor consensus
+4.05%
+53.41%
+17.39%
+16.88%
-30.5%
-
-
-
-54.24%
Solar Foods established in 2017 is a global leader in sustainable protein production, solving the global food production problem by offering a completely new alternative to existing animal and plant proteins. Solar Foods’ first product is the naturally occurring single-cell protein Solein®, which can be used as a food raw material with high protein content. In the long run, Solein production will improve global availability of protein and increase price and quality stability of food raw materials by disconnecting food production from agriculture.
Read moreMarket cap
133.06M EUR
Turnover
105.42K EUR
P/E (adj.) (25e)
EV/EBIT (adj.) (25e)
P/B (25e)
EV/S (25e)
Dividend yield-% (25e)
Revenue and EBIT-%
Revenue M
EBIT-% (adj.)
EPS and dividend
EPS (adj.)
Dividend %
Financial calendar
14.8.
2025
Interim report Q2'25
Risk
Business risk
Valuation risk
Low
High
All
Research
Webcasts
Press releases
ShowingAll content types
Rami Jokela starts as CEO of Solar Foods to lead the global growth
The Japanese food giant Ajinomoto continues to introduce new Solein®-powered products in Singapore
Join Inderes community
Don't miss out - create an account and get all the possible benefits
FREE account
Stock market's most popular morning newsletter
Analyst comments and recommendations
Stock comparison tool
PREMIUM account
All company reports and content
Premium tools (e.g. insider transactions & stock screener)
Model portfolio
Resolutions of Solar Foods Oyj's Annual General Meeting 2025 and organisational meeting of the Board of Directors
Carnegie Access: Solar Foods: Sustainable foodtech
Solar Foods announced its first million-dollar supply agreement
Inside information: Solar Foods signs Supply Agreement with Superb Food in the United States
Solar Foods announces an investment plan for Europe’s single largest emission reduction moonshot project
Fazer introduces new Solein®-powered products in the United States
Solar Foods signed first MoUs for production at future industrial-scale facility
Solar Foods has signed two MoU’s regarding commercialisation of 6,000 tonnes of Solein per year
Solar Foods introduces the protein snack of the future

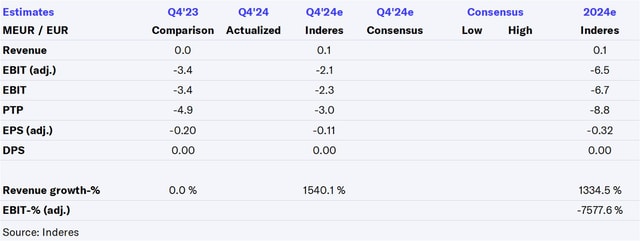
Solar Foods H2'24: Growth seems to take longer than expected

Solar Foods, Webcast, Q4'24
Notice to the General Meeting 2025 of Solar Foods Oyj
Solar Foods Board of Directors' Report, Financial Statements and Auditor's Report for 2024 have been published
Solar Foods Oyj Financial Statements Release 1.1.-31.12.2024: Transformative year sets the foundation for the next strategy period
Solar Foods granted 10 MEUR funding under the European Commission's 110 MEUR IPCEI notification
Inside information: Solar Foods has been granted EUR 10 million funding related to the research, development and go-to-market for Solein protein

