Log in to your Inderes Free account to see all free content on this page.
Remedy Entertainment
14.6
EUR
+0.83 %
11,299 following
REMEDY
NASDAQ Helsinki
Software
Technology
Overview
Financials & Estimates
Ownership
Investor consensus
+0.83%
+7.04%
+5.04%
+3.84%
-8.75%
-11.62%
-55.96%
-27%
+118.24%
Remedy Entertainment is a game developer. The business is primarily focused on the development of action games, with a particular focus on 3D technology. Examples of games developed by the company include several different versions of Alan Wake, Max Payne, and Control. Remedy also develops its own game engine and utility technology that powers many of the games. The company was founded in 1995 and has its headquarters in Espoo.
Read moreMarket cap
198.34M EUR
Turnover
69.14K EUR
P/E (adj.) (25e)
EV/EBIT (adj.) (25e)
P/B (25e)
EV/S (25e)
Dividend yield-% (25e)

Revenue and EBIT-%
Revenue M
EBIT-% (adj.)
EPS and dividend
EPS (adj.)
Dividend %
Financial calendar
30.4.
2025
Business review Q1'25
12.8.
2025
Interim report Q2'25
29.10.
2025
Business review Q3'25
Risk
Business risk
Valuation risk
Low
High
All
Research
Webcasts
Press releases
ShowingAll content types
Remedy's FBC: Firebreak will be released on June 17
Remedy Entertainment Plc: FBC: Firebreak to Launch Worldwide on June 17
Join Inderes community
Don't miss out - create an account and get all the possible benefits
FREE account
Stock market's most popular morning newsletter
Analyst comments and recommendations
Stock comparison tool
PREMIUM account
All company reports and content
Premium tools (e.g. insider transactions & stock screener)
Model portfolio
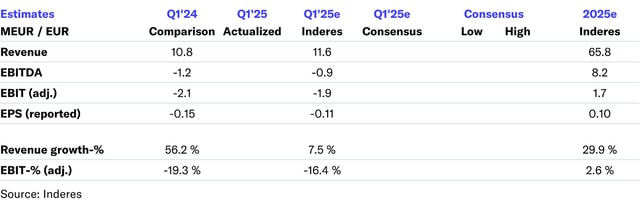
Remedy Q1'25 preview: In anticipation of FBC: Firebreak release

Remedy Entertainment, Webcast, Q1'25
Resolutions of Remedy Entertainment Plc’s Annual General Meeting and the organizing meeting of the Board of Directors
New trailer released for Remedy's FBC: Firebreak coming this summer
Remedy Entertainment Plc: FBC: Firebreak coming in Summer 2025
Remedy Entertainment Plc: Notice to the Annual General Meeting of Remedy Entertainment Plc
Remedy Entertainment Plc: Remedy’s Annual Report 2024, Financial Statement, Remuneration Report and Corporate Governance Statement have been published
Remedy Entertainment Plc: Managers' Transactions – Kai Tavakka

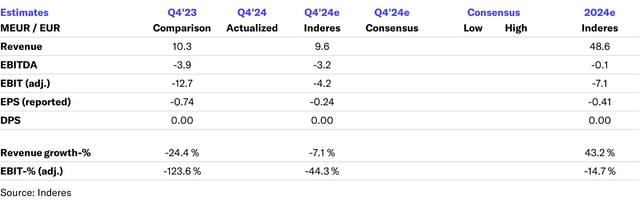
Remedy Q4'24: FBC: Firebreak release draws nearer
Remedy Entertainment Plc: Financial Statements Release January-December 2024: Alan Wake 2 sales exceeded 2 million units and the game started to accrue royalties, updated company strategy and growth objectives announced