Log in to your Inderes Free account to see all free content on this page.
Orthex
5.02
EUR
+3.72 %
4,369 following
ORTHEX
NASDAQ Helsinki
Home Products
Consumer Goods & Services
Overview
Financials & Estimates
Ownership
Investor consensus
+3.72%
-1.57%
-0.79%
+0.4%
-19.03%
-30.85%
-35.64%
-
-32.3%
Orthex is a Finnish manufacturer and supplier of household products. The company offers a range of products such as plastic boxes for storage, cutting boards, pots, bowls, and other accessories for the kitchen. Most of the range is accessed digitally via the company's e-commerce platform, and the products are offered via licensed resellers. The largest operations are in the Nordic market.
Read moreMarket cap
89.15M EUR
Turnover
73.04K EUR
P/E (adj.) (25e)
EV/EBIT (adj.) (25e)
P/B (25e)
EV/S (25e)
Dividend yield-% (25e)
Revenue and EBIT-%
Revenue M
EBIT-% (adj.)
EPS and dividend
EPS (adj.)
Dividend %
Financial calendar
29.4.
2025
General meeting '25
30.4.
2025
Half year dividend
15.5.
2025
Interim report Q1'25
Risk
Business risk
Valuation risk
Low
High
All
Research
Webcasts
Press releases
ShowingAll content types
Orthex Oyj: Orthex Corporation: Annual and Sustainability Report 2024 published

Orthex Q4'24: Better than feared
Join Inderes community
Don't miss out - create an account and get all the possible benefits
FREE account
Stock market's most popular morning newsletter
Analyst comments and recommendations
Stock comparison tool
PREMIUM account
All company reports and content
Premium tools (e.g. insider transactions & stock screener)
Model portfolio

Orthex, Webcast, Q4'24
Orthex Oyj: Orthex Corporation: Notice to the Annual General Meeting 2025
Orthex Oyj: Orthex Corporation: Financial statements release 1 January-31 December 2024

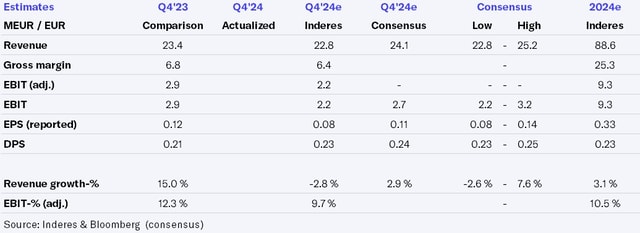
Orthex Q4'24 preview: Progress checkpoint for European growth strategy
Orthex Oyj: Orthex to publish Financial statements release 2024 on Wednesday, 12 March 2025

Orthex: Growth hampered by sputtering partners
Orthex Oyj: Orthex Corporation: Proposals of the Shareholders' Nomination Board to the Annual General Meeting 2025
Orthex Oyj: Orthex commits to Circular Economy Green Deal
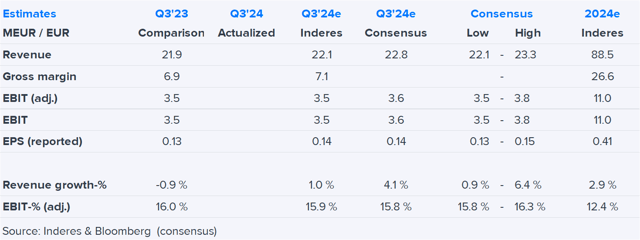
Orthex Q3'24: Price drop opens up the game

Orthex, Q3'24
Orthex Oyj: Orthex Corporation: Interim Report January-September 2024
Orthex Oyj: Orthex Corporation: Financial reporting and AGM in 2025
Orthex Oyj: Orthex Corporation: Change in the Management Team

