With roots back to 1851, Gabriel is today a niche company within the global furniture industry, which throughout the value chain, from idea to furniture user, develops, manufactures and sells furniture fabrics, components, upholstered surfaces and related products and services, through its business areas Fabrics, FurnMaster, SampleMaster and Screen Solutions. Gabriel sells B2B, and is growing with the largest market participants, working closely with leading international manufacturers and major users of upholstered furniture, seats and upholstered surfaces.
Gabriel has pre-announced its preliminary FY’24/25 results ahead of the annual report on 20 November 2025, confirming stronger-than-expected performance in the core continuing operations, while the FurnMaster unit again weighs on the group result. The preliminary figures show continuing operations revenue of DKK 516m (+6.8% y/y) and EBIT of DKK 44m (8.5% margin), exceeding the latest guidance of DKK 35-40m. At the same time, the pre-announcement reveals a deeper-than-expected full-year EBIT loss of DKK 16m in FurnMaster, underlining the operational and strategic challenges in the discontinuing operations as the carve-out process continues. The early release of results reduces uncertainty around the turnaround in the core business but also reinforces known risks tied to FurnMaster’s performance and valuation.
Following the preliminary full year 2024/25 results, Gabriel is building confidence in its turnaround, after a cyclical market downturn, and restructuring of its FurnMaster (discontinuing) Mexican subsidiary. Execution in the core continuing operations remained solid with revenue growth of 6.7% y/y to MDKK 516, and EBIT margin expansion of 4.4 p.p. to 8.5% from 4.1% in 2023/24, despite ongoing macro headwinds. However, the FurnMaster unit remains uncertain with an implied negative full-year EBIT of MDKK -16 for 2024/25, and uncertainty relating to the carve-out and development of tariffs. In our view, a valuation of EV/EBIT 11.6x for 2025/26E does not favor short-term risk/reward, given FurnMaster’s ongoing weaker performance, carve-out uncertainty, and lingering market weakness. We reiterate our Reduce recommendation and slightly raise our price target to DKK 210/share.
Following the Q3 2024/25 results, Gabriel is building confidence in its turnaround, after a cyclical market downturn, and restructuring of its FurnMaster (discontinuing) Mexican subsidiary. Execution in the core continuing operations remained solid with Q3 growth of +5% y/y, and margin expansion, despite macro headwinds. However, the FurnMaster unit had not returned to positive EBIT as expected, showing stabilization rather than rebound. In our view, a current valuation of EV/EBIT 23.9x for 2024/25e does not favour short-term risk/reward, given ongoing carve-out uncertainty and still short-lived growth and margin recovery. We reiterate our Reduce recommendation and slightly raise our price target of DKK 200/share.
Following the Q2 2024/25 results and subsequent guidance upgrade, Gabriel is beginning to distance itself from the challenges seen in 2023 and 2024. This rebound is being driven by improving operating leverage in Fabrics and SampleMaster (continuing) and a return to profitability in FurnMaster (discontinuing). Still, we remain cautious: the carve-out process is incomplete, macro conditions remain mixed, and Gabriel’s ability to sustain earnings momentum beyond FY24/25 is not yet proven. We restate our “Reduce” recommendation but raise our price target to DKK 190/share and look for the full Q3 report for details on the sustainability of the recovery.
Gabriel upgrades EBIT guidance and narrows its revenue guidance to the top-end, for continuing operations 2024/25e (1 October 2024 - 30 September 2025), following strong execution in its continuing Fabrics and SampleMaster segments.
Continuing operations revenue guidance is narrowed to MDKK 510-520 million, up from the previous range of MDKK 495–520, following 7% revenue growth y/y 9 months YTD, and +8% y/y over the first 10 months YTD. The revenue growth has significantly boosted margins with EBIT for 2024/25e now expected at MDKK 35-40m, up from MDKK 25-35 previously, and from MDKK 19.7 in 2023/24.
Gabriel delivered better-than-expected Q2 2024/25 results, with growth in continuing operations accelerating to 10.5% y/y, slightly above the top-end of the guidance range. Margins also developed positively, with continuing operations EBIT of MDKK 20.9 H1’24/25, at the lower-end of guidance. Revenue from discontinuing operations declined as unprofitable contracts were terminated, but with a positive EBITDA in Q2’24/25 and growth in Europe. Despite the stronger Q2’24/25 results, risks remain elevated, as we await the conclusions from the forensic investigation into Mexican subsidiary’s accounts, updates from the ongoing carve-out process, and heightened tariff-related uncertainty. The lack of a guidance upgrade also suggests a weaker H2’24/25 is projected, and while the larger European activities should be relatively insulated from tariffs, economic growth risks are elevated. While the Q2’24/25 results support our long-term view that Gabriel is well-positioned to benefit from a broader market rebound given its operating leverage and outperformance in weak markets, we see significant hurdles to overcome in order to de-risk the case. We therefore reiterate our “Reduce” recommendation with a revised price target of DKK 150 per share, raised from DKK 130 previously.
The sweeping tariffs announced by President Donald Trump on 02 April 2025 are reshaping global trade, introducing uncertainty, and with trade barriers likely to drive a negative global growth shock. While tariff negotiations are ongoing and subject to significant change in both directions, Gabriel’s production, particularly in Mexico, could be directly affected, with indirect impacts likely to drive a weaker outlook in H2’2024/25 and into 2025/26. The European market, also the largest market, may be somewhat more insulated against tariff impacts, however, we expect the indirect effects, such as higher lending/mortgage rates, can delay the rebound in the real estate and furniture fabrics market conditions, resulting in greater short-term challenges. The increased macro and policy uncertainty may also present an obstacle in the ongoing carve-out process of FurnMaster, a key driver of near-term uncertainty. Despite the long-term outlook remaining solid, with operating leverage to benefit from an eventual market rebound, the tariff-driven uncertainty lead us to reiterate our Reduce recommendation with a revised price target of DKK 130 per share.
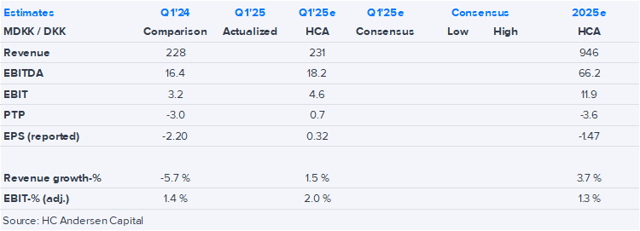
Gabriel’s Q1’24-25 results reflected relative stability during a moment of heightened uncertainty. A stable revenue of MDKK 228.1 (MDKK 227.7 Q1’23-24) was slightly below our expectations of +1% growth y/y as positive development in continuing operations was offset by a decline in FurnMaster driven by the restructuring of its Mexican subsidiary. Q1 was the first step towards greater stability, however, uncertainty relating to the carve-out process of FurnMaster remains high, and the range of outcomes is broader than normal. Group EBIT of MDKK 0.3 in Q1’24-25 was below our estimate of MDKK 4.6, impacted by elevated costs relating to restructuring, accounts verification, and carve-out advisory fees. The Q1 results support our view of long-term potential in the company, however, also reinforce our view of greater short-term risk due to the FurnMaster carve-out process. We reiterate our Reduce recommendation with a slightly revised price target of DKK 180 per share from DKK 195 previously.
We estimate a small positive topline growth year-on-year in Q1’24-25 as the stable to slightly improving market backdrop with lower interest rates and inflation, can support a slight positive development in the group despite challenges.