Log in to your Inderes Free account to see all free content on this page.
Faron Pharmaceuticals
2.75
EUR
-0.36 %
5,187 following
FARON
First North Finland
Biotechnology & Pharmaceuticals
Health Care
Overview
Financials & Estimates
Ownership
Investor consensus
-0.36%
+28.81%
+15.79%
+8.27%
+4.96%
+84.81%
-5.17%
-41.74%
-20.98%
Faron is a global, clinical-stage biopharmaceutical company, focused on tackling cancers via novel immunotherapies. Its mission is to bring the promise of immunotherapy to a broader population by uncovering novel ways to control and harness the power of the immune system. The Company's lead asset is bexmarilimab, a novel anti-Clever-1 humanized antibody, with the potential to remove immunosuppression of cancers through reprogramming myeloid cell function. Bexmarilimab is being investigated in Phase I/II clinical trials as a potential therapy for patients with hematological cancers in combination with other standard treatments.
Read moreMarket cap
306.9M EUR
Turnover
616.84K EUR
P/E (adj.) (25e)
EV/EBIT (adj.) (25e)
P/B (25e)
EV/S (25e)
Dividend yield-% (25e)

Revenue and EBIT-%
Revenue M
EBIT-% (adj.)
EPS and dividend
EPS (adj.)
Dividend %
Financial calendar
27.8.
2025
Interim report Q2'25
Risk
Business risk
Valuation risk
Low
High
All
Research
Webcasts
Press releases
ShowingAll content types
Carnegie Access: Faron Pharmaceuticals: Enters into convertible bond agreement
Inside Information: Faron enters into an up to EUR 35 million convertible bond arrangement and issues first tranche of bonds with a principal amount of EUR 15 million
Join Inderes community
Don't miss out - create an account and get all the possible benefits
FREE account
Stock market's most popular morning newsletter
Analyst comments and recommendations
Stock comparison tool
PREMIUM account
All company reports and content
Premium tools (e.g. insider transactions & stock screener)
Model portfolio
Faron Announces Acceptance of Bexmarilimab Data for Oral Presentation at 2025 Annual MDS Foundation Congress
Board Changes
Results of the Annual General Meeting, Change of Directors, Decision of the Board meeting after the AGM
Carnegie Access: Faron Pharmaceuticals: Cancer meets a clever opponent
Shareholders’ Nomination Board updates its recommendation on the number of Board members to be elected and the persons proposed to be elected
Orphan drug status for Faron in the US
Inside Information: FDA Grants Orphan Drug Designation for Bexmarilimab in MDS
NOTICE OF FARON PHARMACEUTICALS LTD’S ANNUAL GENERAL MEETING
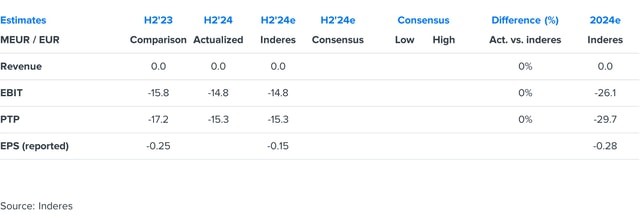
Faron H2'24: Towards April readout
Redeye: Faron Pharmaceuticals H2 - En route to pivotal studies
Faron, Webcast, Q4'24
Inside Information: Faron Receives Positive EMA Opinion on Orphan Drug Designation for Bexmarilimab for the treatment of myelodysplastic syndrome (MDS)
Faron Pharmaceuticals Ltd’s Annual Report 2024 published
Faron’s Financial Statement Release 1 January to 31 December 2024